coal2nuclear.com             A Plan for Our Planet
 to    Section Directory          >  A PLAN FOR OUR PLANET         Download this page as a pdf             Back <> to NEXT page

A Plan For Our Planet
There are sufficient diffuse fossil fuels for a dozen Global Warmings.  By making fossil fuels obsolete, we can be certain Global Warming will never return.
 
Look at all that electricity.  Out of 60,000 power plants scattered across the world, 30% of ALL Global Warming is made by just 1,200 supersized power plants.
100% of all Global Warming is made for HEAT.  It is life-and-death important that we keep electricity and FOSSIL FUEL HEAT separate in our minds.

Introduction to "A Plan For Our Planet."
Part  1
    A Problem For Our Planet:  Global Warming.  Mother Nature buries her excrement.  Humans dig it up and burn it. 
Part  2    Scoping out Global Warming with an eye to dividing and conquering it.  There is a little "wriggle room."
Part  3   
Dividing and conquering Global Warming by rounding up the fossil fuel boilers.  What will happen when we do achieve ZERO fossil fuel burning?
Part  4    Renewable redux:  Why wind won't quite work: It doesn't make heat.  Or predictable electricity.
Part  5    Feeling the heat: Nuclear heat is natural.  Fire heat (combustion) is the universe's freak energy phenomenon. 

Part  6    HEAT, not electricity, is what the Global Warming Struggle is really about.  2/3 of all Global Warming is made in boilers.
Part  7    NUCLEAR: Pure Energy.  BIG NUCLEAR, LITTLE NUCLEAR.  NEW SMALL REACTORS ON PARADE
Part  8    Big nuclear's heat weaknesses, small nuclear's heat strengths. 
Big nuclear without little nuclear will kill a country's commerce and industry.
Part  9   
Economics of making fossil fuels obsolete and going nuclear. 
Continued on 
Nuclear:  Energy's Final Frontier  page.

The only thing you need to know about Global Warming is that by burning fossil fuels you are pushing Planet Earth's thermostat up a bit more. 

_______________________________________________________________________

Introduction to "A Plan For Our Planet"

Out of the caves: When the mild climate of the Holocene epoch began, early man had already been around for over 3 million years - living more or less like other pack animals - in scattered tribes of hunter-gatherer breeding pairs.  The optimum climatic conditions that began at the end of the last glacial period 12,000 years ago is generally considered to have been the best ever for human life because the milder climate enabled man to live better.  As the Holocene epoch continued, its mild climate enabled large, non-roving, agriculture-based civilizations to be established in the fertile valleys of many large rivers - such as the Nile. 

(Speculative aside: 12,000 years, in geological time, isn't that far off in time from the Bible's 6,000 year ago time of Genesis.  The Holocene's mild climate must have instinctively seemed to man to be a paradise on earth compared to the previous cold, harsh, Pleistocene glacial times - "Dreamtime.") 

Planet Earth's temperature line is now rising into uncharted territory.  The party's over.  By introducing Global Warming, man has ended the Holocene epoch and begun the "Global Warming" epoch.

Welcome to Hell on Earth.  We are already IN the Global Warming epoch.  Species die-off (extinction) is well under way.  In the author's opinion, the turning point for certain was 1983.  The only issue that remains is how bad are we going to let it get?  As you can see from Planet Earth's past climates (below), it doesn't take a big temperature change for climates to get really bad.  Notice that during the Pleistocene epoch, between 500,000 and 12,000 years ago, it only took a loss of 2 degrees C to bring on glaciers.


Blue Line:  About the time of dinosaurs and coal.  Red Line: About the time of Lucy (Australopithecus) a small early hominid, about 3.2 million years ago.  Green Line:  About the time of first modern man: http://en.wikipedia.org/wiki/Human 


From Dr. James E. Hansen's  What Global Warming Looks Like 1880 to 2010.  Published August, 2010.

(Log scale graph image created by Robert A. Rohde / Global Warming Art.)  http://commons.wikimedia.org/wiki/File:2000_Year_Temperature_Comparison.png#Reconstructions  How these temperature graphs were derived.
http://www.globalwarmingart.com/wiki/Global_Warming_Art:License    http://www.globalwarmingart.com/wiki/Thumbnail_gallery_of_all_images  

Today's situation.  The amount of carbon dioxide (CO2) in the air is a major controller of Planet Earth's temperature.  The higher the amount of CO2, the higher the temperature.  Above 200 parts per million (ppm) atmospheric concentrations CO2's infrared behavior is quite linear and the thermal sensitivity of Planet Earth to atmospheric CO2 is well known to be about 3°C (5.4°F) for each doubling of atmospheric CO2.  Before man began burning massive amounts of fossil fuels - coal, natural gas, and oil, atmospheric CO2 concentration was about 250 ppm.  It is now about 390 ppm.  Every time you start your car you are adding to the CO2 in the air which, in turn, pushes Planet Earth's thermostat set-point even higher.

A second major controller of Planet Earth's temperature, methane (CH4), is beginning to kick in.  Unlike CO2, current atmospheric concentrations of methane are extremely low (.0017 ppm) but unfortunately methane's infrared absorption effect at this concentration level is highly non-linear - so a 1 ppm increase in atmospheric methane concentration could produce twenty times the planetary heating effect of the same ppm increase in CO2.  Please take another look at the chart that shows both carbon dioxide (CO2) and methane (CH4) one-above-the-other, this time paying attention to the current level of CO2.

Climate Change, like cancer, is a progressing physical fact that must be recognized, understood, and dealt with promptly with effective measures.  Currently most of us are in the mental state of denial and are ignoring Global Warming, while the non-deniers are generally pursuing ineffective green quackery remedies such as windmills and solar panels. 

The fuss is all about SLOWING or HALTING Global Warming's progress.  No one is even talking about reversing Global Warming.  We have already gone over the 350 ppm cliff that locked us into a progressive warming mode.  To use the cancer analogy, Global Warming's metastasis stage will be the rapid release of massive amounts of the second greenhouse gas, methane (CH4) from thawed arctic tundra and undersea hydrates The first book describing in simple terms Global Warming's second stage is The Climate Trap .  See also: Methane Hydrates .pdf

Climate change is very dangerous.  Every degree C of temperature increase causes about a 5% loss of the world's grain crops through unseasonal weather along with more fundamental losses at the bottom of the food chainCrop failure.  Diagram: Climate Change Impacts .bmp   Text: Climate Change Impacts .pdf 
Climate Change Mega-Catastrophes .pdf  - A realistic assessment.

Just the fear of starvation will quickly cause an otherwise prosperous nation's people to clamor for war.

While Global Warming confirms that man IS capable of altering Planet Earth, it appears that the task of going beyond halting to reversing Global Warming will take us far deeper into the risky uncertainties of geoengineering.  If we fail to halt, and then reverse, Global Warming, adapting to an increasingly hotter world will be our fate.

Here is an agricultural idea for putting the air's CO2 BACK INTO THE GROUND:  http://www.youtube.com/user/AllanYeomans1?feature=mhw4#p/a/u/1/B97nYzcwSg0 

We know what needs to be done.  End burning of coal, natural gas, and oil.  Not just replace them, but obsolete them with the only other controllable source of heat energy man has - nuclear fuels.  If fossil fuels are not made obsolete, man will return to his Global Warming ways in the near future because it is far easier to make a lump of coal hot than it is to make a lump of uranium hot.   Take a look at all the carbon there is on Planet Earth.

This web site provides an excellent "Plan for the Planet" to quickly end 30% of Global Warming's growth immediately (the supersized coal burning power plants) and also provides additional ideas for ending another 30% of Global Warming's growth.  See also:  http://www.aip.org/history/climate/  The Discovery of Global Warming 

_______________________________________________________________________

Part  1Global Warming made simple.  Mother Nature buries her excrement.  Humans dig it up and burn it.  

A Problem For Our Planet:  Global Warming.

The single change that made Global Warming happen.  


A square meter is about the size of a card table.  Since before the time of the last Glaciers - over 12,000 years ago - planet Earth has been receiving average daily energy from the sun as white light of about 235 watts per square meter intensity and then re-radiating that same amount of energy into the cold of space as infrared heat at night.  Man, who has been around for 3 million years in some form and 50,000 years as modern man, never thrived in the environments provided by earlier climates (there are no stone ruins of pre-glacial civilizations) before this equal energy balance climate began after the last ice age.

The change.  This energy balance was lost when man began burning fossil fuels instead of carbon-neutral fuels such as wood.  By about 1750, the people of Europe had cut down most of their forests for firewood.  Once wood became difficult to obtain, they began to burn chunks of coal found lying on the ground and easily obtainable just beneath the surface. 

Mankind is now producing almost 30 billion tons of fossil CO2 per year and Nature can only remove from the air and place in plants about 10 billion tons each year, leaving a surplus of 11 billion tons accumulating in the air each year and 6 billion tons accumulating in the oceans each year.  Over the years this has caused about a trillion tons of extra CO2 from fossil fuel burning to be added to the atmosphere and about half that much to the oceans.

Along with small amounts of other greenhouse gases, the carbon dioxide man has been adding to the air through fossil fuel burning is like a person in bed adding another blanket - it is now trapping an extra 2.4 watts of heat energy - less than a night light - per day, per square meter of earth's surface by blocking in a little more of that infrared energy that should get back out into space to keep planet Earth's temperature where it should be. 

Since the earth has 120 trillion square meters of surface, this imbalance comes to a constant net gain of 288 trillion (1012) watts of heat (or 740 Quads - the U.S. uses about 100 quads of energy each year).  This 740 Quads of additional trapped heat from the sun is causing the temperature of earth to slowly increase, which in turn, is causing earth's climates to slowly change.  It took us 260 years to get to this point.  This is how man finally did something powerful enough to mess up the entire world.

Earth's thermostat has been re-set and Planet Earth is beginning to warm up.  It is nowhere near the new set-point and, since we are constantly adding more fossil CO2 to the air, we are continuing to push the set-point higher and higher - so we can only get hotter.   See also Note 3.

_______________________________________________________________________

Part  2

Scoping out Global Warming with an eye to dividing and conquering it.

  Global Warming's Carbon Dioxide (CO2) Dimensions. 
How Nature is handling Man's CO
2.
 

Man's and Nature's CO2 SOURCES and HOW NATURE IS DISPOSING (or SINKING) THEM:  At right is the IPCC (Intergovernmental Panel on Climate Change) drawing that describes, in just a few numbers, all the basic dimensions of Global Warming

It shows where Global Warming's carbon dioxide (CO2) is coming from, where it is going, and how much is coming and going.

The numbers are in billions of metric tonnes of carbon dioxide per year. (a tonne is 1,000 kilograms or 2,200 pounds).

The arithmetic goes like this:  On the far right, the oceans are putting 332 billion tonnes (or Giga tonnes or Gt) of carbon dioxide into the air while taking out 338 Gt - making a net withdrawal from the air of 6 Gt every year.  Some of the carbon sinks to the bottom of the oceans, becomes covered with mud and, over millions of years, might be turned into oil.

In the middle, vegetation and mulch on the ground are putting 439 Gt into the air while taking out 450 Gt - making a net withdrawal from the air of 11 Gt every year.  Some of the carbon becomes buried and, over millions of years, might be turned into coal.

On the left, man is digging up coal, pumping oil, and releasing as natural gas some carbon that didn't make it into oil.  Burning it all, man is putting 29 Gt of carbon dioxide into the air and not removing anything.  The arithmetic is simple  29 minus 6, minus 11, leaves 12 left over to accumulate every year in the air like interest on money in a checking account.  This means Man is overwhelming Nature's ability to remove CO2 from the air by 12 billion metric tonnes (or 13 billion U.S. tons) per year. 

Man is also cutting down more trees than nature can cope with.  Not surprisingly, it is called "Land Use and Deforestation".

Massive amounts of carbon are available on Planet Earth.  Over the last 150 years or so, an excess of well over a trillion tons of extra CO2 has accumulated in the air, increasing the concentration of CO2 from 250 parts per million to today's level of about 380 parts per million. 

Acting like a greenhouse's glass, CO2 is a gas that is very transparent to short wavelength energy - such as the white light energy coming directly in from the sun - but is more opaque to long wavelength energy such as the infrared heat energy being radiated back out into the coldness of space by the surface of planet earth.  
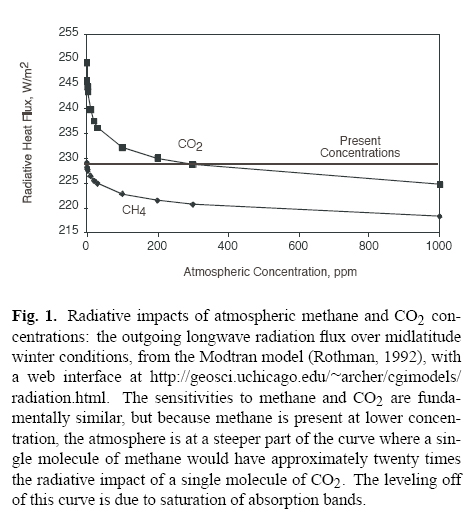
How?  What does this tell about both CO2 and methane?  Look again and read carefully.  More than they want you to know about Global Warming?


FOSSIL FUEL'S CO2 SOURCE DIMENSIONS:  The author obtained the coal, natural gas, and oil CO2 amounts that man is putting into the air from another official IPCC diagram: World Energy Flows.  The sources and sinks for energy.  (Click on it to download a larger, printable pdf image.)  A similar diagram for just the United States.

Please pay special attention to the three gray waste bins in the left-center of the diagram.  That's the CO2 from the fossil fuels man is burning.  The different CO2 amounts man is dumping into the air are written on the waste bins. 

This diagram uses 2004 data, the nature diagram uses 2007 data.  The 2004 data is a bit smaller.


CO2 SOURCES and SINKS SIDE-BY-SIDE:  Using the official IPCC numbers from both of the above, the author drew a pair of stacked bar charts (bar lengths proportional to the amounts of CO2 they represent) showing where man is getting his CO2 sources and what nature is doing with the CO2 man is dumping into the air.    As they should, the stacked bars segments add up to the same total length.

(Nature's CO2 sources are not shown, only man's contribution and what Nature does with it.)

1. The 11 Gt going into land plants and the ground (green bar) doesn't seem to be hurting anything so its a "don't care".

2. The 6 Gt going into the oceans (light blue bar) is making the oceans more acidic since the CO2 is turning into carbonic acid that is harming most sea life.

The thickness dimension of Planet Earth's blanket:

3. The 12 Gt going into the air (red bar) is acting like the glass in a greenhouse - letting heat from the sun in as it always has, but not letting quite as much heat back out into the extreme cold of space as it used to.  More CO2 is like glass becoming more intensely tinted and thus trapping more heat as a consequence.  We know this is a threatening situation.  CO2 Truly is a Heavyweight Greenhouse Gas .pdf

So, there it is.  Global Warming in a nutshell.  You now know how much CO2 from each CO2 source Man is making, how that CO2 is being distributed among Nature's air, land plants, and oceans, and why increasing the amount of CO2 in the air will increase Planet Earth's warmth which, in turn, changes Planet Earth's climate. 


It's mostly carbon dioxide - along with small amounts
 of some other greenhouse gasses.  (U.S. quantities.)


Hey!  What about water vapor?  The author thinks he recalls that CO2's heating effect amplifies water vapor by a factor of seven, i.e., warmer air
can hold more water.  For more, see National Geographic's: 
Water Vapor Supercharges Global Warming .pdf

2/3 of the people on Planet Earth depend upon agri-tech grains that, in turn, depend upon very predictable growing seasons.  This is why Global Warming is a threat.

_______________________________________________________________________

Part  3: 

    Dividing and Conquering Global Warming
by Rounding Up the Fossil Fuel Boilers.
 
Quickest, cheapest, way is switching from fossil fuel boilers to nuclear fuel boilers.

How much of all Global Warming CO2 can nuclear boilers prevent?
About 63%

To arrive at these estimates, the author used the amount of CO2 known to be coming from the applications in question.  Almost always the emissions were from boilers (next section).   They were then entered in Excel, and plotted in stacked bar chart form using Excel's "Chart Wizard".

63% of ALL Global Warming CO2 emitters can be REPOWERED with nuclear.
We don't have to give up the benefits - just the Global Warming CO
2.

The left stacked bar on the graphic is all of Man's Global Warming CO2 in Giga tonnes per year (2007 annual Global Warming CO2 was about 29 Giga tonnes.). 
Coal is
grey, Natural Gas is yellow, Oil is tan, Deforestation is light green.

The right stacked bar (Totem Pole) shows CO
2 emitter components that could be replaced with nuclear.

Breaking Global Warming into its component parts

Color                      CO2 Emitter                                   The Nuclear Replacement
Turquoise:    Sea water desalination - either nuclear heat flash distilled or reverse osmosis.
Blue:            Large Ocean Ships powered by conventional naval reactors.
Dark Green:  Electricity from oil replaced by modular reactors i.e.,
mPower  NuScale
Purple:         Residential Electricity, Heating, Cooling.  Conventional nuclear electricity.

Light Blue:    Small gas fired commercial boilers.  Conventional nuclear electricity.
Blue:            Large gas fired industrial boilers replaced by Hyperion type hot tub reactors.
Dark Red:     Regular sized power plants replaced by conventional modular reactors.
Bright Red:   Supersized power plants, repowered by Coal Yard Nuke reactor modules.
Gray:            Coal used for firing cement, replaced with high temp. pebble bed reactors.
White:          Coal used mainly for heating and steel.  Conventional nuclear electricity.

Fixing the "Worst First"

The world's 1,200 largest power stations are in the bright red bar.  They are 30% of ALL Global Warming.  Nothing else we can fix quickly will have as much impact on Global Warming.


Overcoming more than 100% of Global Warming means overcoming oil.  We can't survive without oil.  The best we can do is to move from pumped fossil oil to carbon-neutral biogenic oil.  No one seems to be aware of the massive contribution nuclear heat could make in the production of biogenic diesel, gasoline, or ethanol.     To Overcoming Oil.         To gas2gasoline    

Data: "CO2 Source Fuels" from IPCC,  "CO2 Emitters" from EIA fuel usage tables.  "Repowerable" is author's opinion of what can be replaced with the various new nuclear reactors.  Gas usage is U.S., all others, World.

Check my power plant work:
CARMA Groups Minimum Master .xls   (54,000 power plants, 8.3 meg Excel xls file.) ]

What will happen when we do achieve ZERO fossil fuel burning?

"A" (Below) Is what happens when you roll back as much as 100% of Global Warming CO2.
("B" and "C" are for other gas scenarios.  From IPCC FAQ web site.)

Bottom Line:  Global Warming isn't going to go away overnight.

Bioremediation: A one-shot try at getting back to 350 ppm.

A Biosequestration Plan That Might Be Used To Reverse Global Warming In the Event Most Fossil Fuel Burning is Ended

http://www.yeomansconcepts.com.au/priority-one.htm  

Efficacy of this approach?  When you swap out a coal boiler with a nuclear boiler you know exactly how much Global Warming good you will be doing.

In his downloadable book, chapter 5, p89, is where he gets into the relevant details but difficult to ascertain how many pounds of CO2 you pack away into the ground per pound of oil CO2 produced.

As it is with energy, in the early days of oil, 1 barrel of oil would lift 100.  Now, with Canadian Oil Sands, 1 oil barrel of energy gets you 5 barrels of a poor crude that can be 10% of a refinery's mix of better Texas, Gulf, and Mideast sweet crude.  When its 1 to 1, the party is definitely over.

So, how many pounds of CO2 can we recover from the air and sequester in the ground as humus per pound of CO2 made by the fuels that power the tractor that pulls the plow and irrigates the field?  If the oil is carbon-neutral, the party could go on forever.

_______________________________________________________________________

Part  4:   Renewable redux:  Why wind won't quite work: It doesn't make heat.  Or predictable electricity.

Why wind won't quite work: It doesn't make heat.
Wind can't even make predictable electricity.

Humans need constant controllable HEAT more than they need electricity.

The enviro-amateurs often know so little about energy they confuse electricity with heat.

Sometimes wind causes backup gas turbine generators to make Global Warming worse.
About Wind Electricity:    Wind Energy Overview .pdf    Wind Turbine Basics .pdf    Wind - Diesel System .pdf    Wind Farm to Grid Integration .pdf 
Please read about the annular generator described in the "Wind Turbine Basics" section and how they integrate wind's electrical energy into the grid. 
This is, by far, the author's preferred wind turbine design and grid connection system.
This is "Wind Done Right" - it satisfies both the electrical and the electronic aspects of electricity generation and gets my stamp of approval. - Jim Holm

What you see below is what we're really getting.

EXAMPLE: Below is a real-time, 5-minute interval, plot of Bonneville Power's (Northwest U.S.) Load (red), Fossil Fuel electricity generation (brown), and Wind electricity generation (blue).

There is also a Hydro electricity generation component available that is not shown - see Wind - Fossil - Load - Plot - Original .jpg for complete original full plot.  Hydro electricity generation shown on original (green) is also supplying other loads so any shortfalls on this diagram can be considered being made up from either hydro or the electrical grid. 

Bonneville Wind Power buys power from Western Renewable Energy Generation, a large wind farm grid that covers 5 states.  Visit Bonneville's Wind Power sources at: http://www.bpa.gov/power/pgc/wind/wind.shtml    You can see for yourself how Bonneville Power's wind power is doing in the Pacific Northwest at this moment. 
 

Why renewables alone cannot end Global Warming.

In general, this is the end result of a typical fossil fuel plus wind farm team.  The above is a plot of July 10, 2010 through July 17, 2010.  The red plot shows the day-night cycling of the electrical needs of the region around Seattle and Portland.  The brown line represents fossil fuel electricity generation.  When the wind died July 14 and 15, fossil fuel burning kicked in big time to keep the lights on and air conditioners running.

BPA Develops Tool To Track Wind Speed, Direction.
The Tri-City (WA) Herald (8/9/10, McCullen) reports Bonneville Power Administration "has developed an animated map that shows wind speed and direction, temperatures, barometric pressure and humidity measured at 14 weather stations installed last year from Astoria, Ore., to locations near Sunnyside and in the Horse Heaven Hills," which "is taking the guesswork out of predicting wind energy generation for [BPS] employees and making at least a few windsurfers happy." BPA spokesman Michael Milstein explained, "We understand wind fluctuates, but a real challenge is predicting when big ramp-ups in wind generation are to take place," adding, "It's a challenge when it happens, and it is an issue for us because there are so many wind projects clustered in the Columbia River corridor." But "if BPA staffers handling transmission of power know how much wind energy is expected to come into the system, they can schedule for it accordingly, Milstein said."


There is ZERO correlation between electricity need and wind availability so CO2 just continues to be made.


On paper, in some ways, wind turbines and "Mom and Pop" electricity look to be a perfect match:  Small amounts of electricity, remote wind site locations are not remote to nearby rural towns and villages.

Up until 2010, wind electricity has, in general, been given a "Green Pass" by the press.  Now the party's over.  People have noticed that Denmark, after more than 20 years of intense wind turbine construction in one of the best wind locations on earth, has not decommissioned a single one of its many small fossil fuel burning power plants, and currently appears to have the most expensive electricity in the world, almost 35 cents US per kilowatt-hour.
 Electricity for World Households - US DOE 2010 .pdf     Nuclear Energy in Denmark .pdf

More to the point, Global Warming is about heat - and windmills, except for the one at right, are not. 

Wind Generation Does Not Sufficiently Reduce Fossil Fuel Use .pdf  by Rod Adams
( more at:  http://atomicinsights.blogspot.com/2010/09/wind-generation-does-not-reduce-fossil.html )

Wind Intermittency Parts 1 through 5.pdf  Kent Hawkins, Ontario, CA, finds wind's stop-and-go electricity increases CO2 emissions from the natural gas turbines that are filling in the electricity that wind lulls cause.

Wind - Will Wind Reduce Greenhouse  Gas Emissions .pdf


PUTIN CALLS TALK OF WIND AND RENEWABLES “CLAPTRAP.”

In a world where utility companies and even whole nations feel compelled to mouth the litany that renewable energy sources are the future, Russia’s Prime Minister Vladimir Putin is saying the emperor has no clothes.
 
Yesterday Putin called talk of running an economy on wind “claptrap” and said that nuclear is the only “real and powerful” alternative to running the world on fossil fuels. "You couldn’t transfer large electric power stations to wind energy, however much you wanted to,” said the prime minister. “In the next few decades, it will be impossible,"
 
Russia is putting its money where its mouth is. With 31 reactors producing 16 percent of their electricity, the Russians have instituted plans to expand to 50 reactors producing 25 percent of its electricity by 2030.
 
At the same time, Rosatom, the state-owned nuclear company, is helping develop civilian power programs in countries India, China, Iran and Venezuela and many of its former republics and Eastern European satellites. The U.S. and Russia are currently competing heavily on who will help develop an ambitious nuclear program in Vietnam.
 
Foremost among the Russians’ goals in developing nuclear is to reduce of the amount of natural gas used to generate electricity. With the world’s largest natural gas reserves, the Russians have nothing to worry about in terms of supplies. But they correctly perceive that electricity generation is a low-grade use for natural gas – really an outright waste – and are trying to conserve supplies for export. The Russians can get six times the price for natural gas in Europe as they do in burning it at home.
 
The U.S. is currently developing newly discovered shale gas, a strategy that Putin dismissed as “very difficult.”

Read more at Ria Novosti

_______________________________________________________________________

Part  5:   Feeling the heat: Nuclear heat is natural.  Fire heat (combustion) is the universe's freak energy phenomenon. 

Feeling the heat: Nuclear Heat is Natural.
Fire heat (combustion) is the universe's freak energy phenomenon.

Nuclear fission is natural and is heating the core of planet earth at this moment.  Uranium and thorium isotopes that can only come from fission are found in volcano emissions.  Chemical fire, on the other hand, appears to be unique to the particular combination of chemicals found on planet earth at this particular geologic time, i.e., there happens to be enough oxygen in Planet Earth's air (over 15%) to support fire.

(Right) Not simple.  Combustion of a solid fuel.

If the combustion takes place using air as the oxygen source, the nitrogen can be added to the equation (although it does not react) to show the composition of the flue gas.

For more on combustion see:  http://en.wikipedia.org/wiki/Combustion


In the beginning:  Ancient mud puddle nuclear reactors at OKLO, Gabon, West Africa.  Unlike combustion, which is an unnatural chemical reaction not found elsewhere in the universe, fission and fusion are the natural forms of heat.  http://en.wikipedia.org/wiki/Natural_nuclear_fission_reactor 


(Right)  Not too complicated.  Fission of a uranium atom's nucleus.  The slow-moving little blue neutron hits the blue Uranium 235 nucleus making it a Uranium 236.  Like an overfilled water balloon, it breaks apart, making the atoms Krypton 92 and Barium 141 and some heat.  Three neutrons are left over to go on to strike more uranium 235s, if there are any nearby.  If not, the neutrons will usually stop within 6 feet and that will be the end of it.

Example

Consider the nuclear fission of 236Uranium into 92Krypton, 141Barium, and three neutrons.

236U → 92Kr + 141Ba + 3 n

The mass number of 236U is 236 u (atomic mass units), but the actual mass is 236.045563 u, so the mass excess is + 0.045563 u. Calculated in the same manner, the mass excess for 92Kr, 141Ba, and a neutron are − 0.073843 u, − 0.085588 u and 0.0086648 u, respectively. The mass excess of the reactant is + 0.045563 u, and the mass excess of the products is − 0.073843 + ( − 0.085588) + 3 * (0.0086648) = − 0.1334366 The difference between reactants and products is 0.045563 − ( − 0.133436) = 0.1789996 u, which shows that the mass excess of the products is less than that of the reactants, and so the fission can occur.

The resulting difference in mass excess can be converted into energy using 1 u = 931.494 Million electron Volts/c², yielding 166 MeV of heat.

For more on fission see:  http://en.wikipedia.org/wiki/Nuclear_fission 


_______________________________________________________________________


Part  6:                                      HEAT, NOT ELECTRICITY,
           IS WHAT THE GLOBAL WARMING STRUGGLE IS REALLY ABOUT

Let's take another look at ALL the world's energy flows:
(IPCC diagram)

All fossil energy starts out, or is completely consumed, as heat.  A small portion of that heat is converted into electricity (Pink, Red).  Most environmentalists are rank energy amateurs and, as a consequence, do not understand the difference between heat energy and energy that has been converted into electricity.  This is why focusing on electricity generation by windmills and solar cells (Their goal: 20% of all electricity.) will not get us very far at all in the struggle to end Global Warming.

Recall that every bit of FOSSIL CO2 we dump into the air pushes Planet Earth's thermostat higher and that Planet Earth has JUST BEGUN to respond to our re-setting the thermostat about 100 years ago.  The additional heat that is being added is only 740 quads per year (about twice the fossil heat man is producing every year) and, since Planet Earth is very large, temperature increases very slowly.  We are NOWHERE NEAR where today's CO2 setpoint will take us and we sure can't keep pushing that setpoint even higher.  Every time we start our car we are pushing Planet Earth's thermostat setpoint higher.


HEAT, NOT ELECTRICITY,
2/3 of all Global Warming is made in boilers 
Only by ending fossil fuel boilers can we possibly end Global Warming.

Most Global Warming CO2 Happens In Boilers

Where are we burning most of our fossil fuels?  We are burning 2/3 of our fossil fuels in boilers.

What fossil fuels are we burning in our boilers?  Almost all Coal and Natural Gas.
Source:  http://tonto.eia.doe.gov/energyexplained/index.cfm?page=environment_where_ghg_come_from 


15.9 Giga tonnes of CO2 per year is coming from only coal and natural gas - which is burned almost exclusively in the world's 1 billion boilers  


All U.S. boilers combined make almost
TWICE the CO2
as all U.S. vehicles combined.

Transportation 2,014.
 
Electricity Generation, industrial, commercial boilers, hot water heaters, furnaces combined:

=
 3,977


Coal and natural gas boilers can be repowered with nuclear

The boilers that are making 2/3 of Global Warming's CO2 are STATIONARY coal and natural gas burning boilers.

STATIONARY coal and natural gas burning boilers can be replaced with STATIONARY nuclear boilers.

(Right) North American stationary sources of CO2.

Notice all the different kinds of stationary CO2 sources. 

Most of these stationary CO2 sources can be repowered with the new small nuclear boilers.  Hyperion, Toshiba, and NuScale's products come to mind.


This is the turf where the struggle for ending fossil fuels forever will occur.


EPA GHG Thresholds .pdf


Fossil Fuel Boiler Awareness
Most coal and natural gas is burned in boilers so most Global Warming could be considered to be happening in boilers.

Hidden away, largely forgotten, all over the world, perhaps a billion huge-to-tiny boilers, hot water heaters and furnaces are silently making most of the Global Warming CO2 that's overwhelming Nature.  All day, every day. 


Click on pictures for larger images.
 

230 feet high, open-air for cooling, a pair of Babcock & Wilcox supersized coal burning power plant boilers. - Photo: B&W Brochure


Boiler awareness:   Boilers Produce over half of all Global Warming

      5,000 Supersized Coal Burning Boilers in 1,200 supersize power plants are making about 30% of Global Warming's CO
  150,000 Conventional Sized Coal Burning Power Plant Boilers make about 7% of Global Warming's CO2
      
50,000 Natural Gas Burning Electricity Turbines make about 4% of Global Warming's CO2 
 1 Million
Large Industrial and Commercial Natural Gas Boilers make about 4% of Global Warming's CO2
 1 Billion Small Commercial Gas Boilers, residential hot water heaters, and furnaces make about 4% of Global Warming's CO2
Ocean-going ships, which could be nuclear powered, make about 5% of Global Warming CO
2.   Concrete production, which could be nuclear fired, about 4%.

EPA: The United States has 200,000 industrial boilers, heaters and incinerators. (US has about 20% of the world's boiler and heater infrastructure.)

Notes:
1. Boiler population numbers are 2005 world-wide counts or estimates.
2. The advanced nuclear boiler that can replace supersized coal boilers - the BN-800 - is available now.  It is a Russian product.  There is nothing like it in the United States because we are far behind in the BN-800's fast-neutron technology.


(Right) Classic American natural gas burning 800 horsepower industrial boiler.  Click on image to see a cutaway of this boiler - which is the same concept as a classic steam locomotive fire-tube boiler. 
- - Hurst Boiler & Welding     Hurst boiler brochure .pdf 


 (Above) a typical building complex boiler house.  Click on images for larger view. 


Nuclear Boiler Awareness

Until now, only the high value of electricity made huge nuclear power plants economically viable.  Now, as the cost of raw heat becomes more valuable through carbon emission controls, we will see thousands of small nuclear boilers supplying more and more of the heat that used to come from fossil fuels.

There is a fly in the ointment though, a lack of nuclear boilers in the power range of 1 to 25 MegaWatts electrical (1,300 to 33,000 horsepower).  The 800 horsepower boiler above is quite a stretch for electricity to do.

_______________________________________________________________________


Part  7:                                         NUCLEAR: Pure Energy.

It is the author's guess that there are about 1,000 operating power plant, naval, medical, and teaching nuclear reactors in the world.  Feel free to make your own count:  http://en.wikipedia.org/wiki/List_of_nuclear_reactors 

According to the World Nuclear Association, there are a total of 992 power reactors in operation, construction, planned, or proposed.

Big Reactor Technology:
Senator Lamar Alexander's "Blueprint for 100 New Nuclear Power Plants in 20 Years." (pdf)

The big reactors driving the Nuclear Renaissance:
"The Westinghouse/Toshiba AP1000 is the market leader. This design has multiple units under construction in China, with many more planned. It is also the dominant reactor design for new nuclear in the US market, with an approved NRC Design Certification that is being updated. This design is also offered worldwide.

Other designs, including the Chinese CPR1000 and the Russian VVER, have a lot of units built and planned. However, designs are not competing in the world market in the same way as the AP1000. The CPR1000 is only being built in China (for now) and the VVER design is not competing in some key markets, including the USA."  - - For more see:  http://djysrv.blogspot.com/2010/09/two-views-on-nuclear-energy-in-asia.html   

World Nuclear Power Reactors & Uranium Requirements as of 1 August 2010

This table includes only those future reactors envisaged in specific plans and proposals and expected to be operating by 2030.  Longer-range estimates based on national strategies, capabilities and needs may be found in the WNA Nuclear Century Outlook.  The WNA country papers linked to this table cover both areas: near-term developments and the prospective long-term role for nuclear power in national energy policies.

COUNTRY 

(Click name for
Country Profile)
 

NUCLEAR ELECTRICITY GENERATION 2009 

REACTORS OPERABLE  

1 Aug 2010 

REACTORS UNDER CONSTRUCTION  

1 Aug 2010 

REACTORS PLANNED  

 Aug 2010 

REACTORS PROPOSED  

 Aug 2010 

URANIUM REQUIRED 2010 

billion kWh 

% e 

No. 

MWe 

No. 

MWe 

No. 

MWe 

No. 

MWe 

              tonnes U 

Argentina 

7.6 

7.0 

2 

935 

1 

692 

2 

767 

1 

740 

123 

Armenia 

2.3 

45 

1 

376 

0 

0 

1 

1060 


55 

Bangladesh 

0 

0 

0 

0 

0 

0 

0 

0 

2 

2000 

0 

Belarus 

0 

0 

0 

0 

0 

0 

2 

2000 

2 

2000 

0 

Belgium 

45 

51.7 

7 

5943 

0 

0 

0 

0 

0 

0 

1052 

Brazil 

12.2 

3.0 

2 

1901 

 1 

1270 

0 

0 

4 

4000 

311 

Bulgaria 

14.2 

35.9 

2 

1906 

0 

0 

2 

1900 

0 

0 

272 

Canada 

85.3 

14.8 

18 

12679 

2 

1500 

4 

4400 

3 

3800 

1675 

China 

65.7 

1.9 

12 

9624 

24 

26550 

33 

37450 

120 

120000 

2875 

Czech Republic 

25.7 

33.8 

6 

3686 

0 

0 

2 

2400 

1
 

1200 

678 

Egypt 

0 

0 

0 

0 

0 

0 

1 

1000 

1 

1000 

0 

Finland 

22.6

32.9

4 

2721 

1 

1600 

0 

0 

2 

3000 

1149

France 

391.7 

75.2 

58 

63236 

1 

1630 

1 

1630 

1 

1630 

10153 

Germany 

127.7 

26.1 

17 

20339 

0 

0 

0 

0 

0 

0 

3453 

Hungary 

14.3 

43 

4 

1880 

0 

0 

0 

0 

2 

2200 

295 

India 

14.8 

2.2 

19 

4183 

4 

2572 

20 

16740 

40 

49000 

908 

Indonesia 

0 

0 

0 

0 

0 

0 

2 

2000 

4 

4000 

0 

Iran 

0 

0 

0 

0 

1 

915 

2 

1900 

1 

300 

148 

Israel 

0 

0 

0 

0 

0 

0 

0 

0 

1 

1200 

0 

Italy  

0 

0 

0 

0 

0 

0 

0 

0 

10 

17000 

0 

Japan 

263.1 

28.9 

55 

47348 

2 

2756 

12 

16532 

1 

1300 

8003 

Jordan

0 

0 

0 

0 

0 

0 

1 

1000 


0 

Kazakhstan 

0 

0 

0 

0 

0 

0 

2 

600 

2 

600 

0 

Korea DPR (North) 

0 

0 

0 

0 

0 

0 

0 

0 

1
 

950 

0 

Korea RO (South) 

141.1 

34.8 

20 

17716 

6 

6700 

6 

8190 

0 

0 

3804 

Lithuania 

10.0 

76.2 

0 

0 

0 

0 

0 

0 

2 

3400 

0 

Malaysia 

0 

0 

0 

0 

0 

0 

0 

0 

1 


1200 


0 

Mexico 

10.1 

4.8 

2 

1310 

0 

0 

0 

0 

2 

2000 

253 

Netherlands 

4.0 

3.7 

1 

485 

0 

0 

0 

0 

1
 

1000 

107
 

Pakistan 

2.6 

2.7 

2 

400 

1 

300 

2 

600 

2 

2000 

68 

 Poland 

0 

0 

0 

0 

0 

0 

6 

6000 

0 

0 

0 

Romania 

10.8 

20.6 

2 

1310 

0 

0 

2 

1310 

1 

655 

175 

Russia 

152.8 

17.8 

32 

23084 

10 

8960 

14 

16000 

30 

28000 

4135 

Slovakia 

13.1 

53.5 

4 

1760 

2 

840 

0 

0 

1 

1200 

269 

Slovenia 

5.5 

37.9 

1 

696 

0 

0 

0 

0 

1 

1000 

145 

South Africa 

11.6 

4.8 

2 

1842 

0 

0 

3 

3565 

24 

4000 

321 

Spain 

50.6 

17.5 

8 

7448 

0 

0 

0 

0 

0 

0 

1458 

Sweden 

50.0 

34.7 

10 

9399 

0 

0 

0 

0 

0 

0 

1537 

Switzerland 

26.3 

39.5 

5 

3252 

0 

0 

0 

0 

3 

4000 

557 

Thailand 

0 

0 

0 

0 

0 

0 

2 

2000 

4 

4000 

0 

Turkey 

0 

0 

0 

0 

0 

0 

4
 

4800 

4 

5600 

0 

Ukraine 

77.9 

48.6 

15 

13168 

0 

0 

2 

1900 

20 

27000 

2031 

UAE   

0 

0 

0 

0 

0 

0 

4 

5600 

10 

14400 

0 

United Kingdom 

62.9 

17.9 

19 

11035 

0 

0 

4 

6600 

6 

8600 

2235 

USA 

798.7 

20.2 

104 

101216 

1 

1180 

9 

11800 

22 

31000 

19538 

Vietnam 

0 

0 

0 

0 

0 

0 

4
 

4000 

10 

11000 

0 

WORLD** 

2560 

14 

440 

375,805 

59 

60,065 

149 

163,744 

344
 

365,125 

68,646 


billion kWh 

% e 

No. 

MWe 

No. 

MWe 

No. 

MWe 

No. 

MWe 

tonnes U 


NUCLEAR ELECTRICITY GENERATION  

REACTORS OPERATING 

REACTORS BUILDING 

ON ORDER or PLANNED 

PROPOSED 

URANIUM REQUIRED 

Sources: 
Reactor data: WNA to 1/7/10
IAEA- for nuclear electricity production & percentage of electricity (% e) 3/5/10.
WNA: Global Nuclear Fuel Market (reference scenario) - for U. 


Introducing the New Small Modular Reactors (SMRs),
Deep Pockets No Longer A Prerequisite.
Neighborhood Nuclear.

Something SMALL is happening

Remember when millions of microcomputers popped up alongside huge mainframe computers? 
Well, it's
déjà vu time all over again! 
This time it's SMALL, LOW COST nuclear boilers.

A few of the new reactors on parade:
Militaries and Space Agencies around the world have produced portable nuclear reactors as small as backyard grille propane tanks.
A common theme for this generation of more practical reactors is to simply place them in underground silos for radiation containment and physical safety.

mPower *     Hyperion     Toshiba      NuScale     IRIS     PRISM     PBMR     TERRAPOWER     ARC     BN-800     GA *     HTR-10

Red designates reactors on http://www.nrc.gov/reactors/advanced.html docket for certification for manufacture, sale, and operation in the United States.
The power of price will enable thousands of small electricity companies, colleges, industrial and commercial users to move up to clean nuclear energy.
Platts Small Modular Reactor Meeting .pdf      Small Modular Reactors - NEI Position Paper.pdf

B&W to build mPower test facility 28 July 2010  Babcock & Wilcox (B&W) is to construct a test facility for the mPower reactor design in Bedford County, Virginia. The facility - not far from B&W's headquarters in Lynchburg - will be used to support licensing activities for the small, modular reactor design.

It will take not hundreds, but tens of thousands, of small nuclear reactors to make fossil fuels obsolete, end Global Warming, and bring the cost of energy down again*.

http://en.wikipedia.org/wiki/Hydrogen_Moderated_Self-regulating_Nuclear_Power_Module  Dr. Peterson's original reactor.
http://en.wikipedia.org/wiki/List_of_small_nuclear_reactor_designs  List of small nuclear reactor designs.
THORIUM instead of URANIUM:   
www.nucleartownhall.com  Interview: Thorium Proponent Kirk Sorenson .pdf     Is Thorium really a viable option? 
 

Nuclear isn't just for electricity anymore
Fridge Sized Nuclear Reactors to Tap 135 Billion Dollar Energy Market .pdf

Many companies will soon be offering small "hot tub" modular nuclear "heat batteries" to replace coal and natural gas burning boilers.  Depending on the model, every 5 to 30 years you swap it out for a fresh one.


Reasonably priced, automatic and intended for large groups of buildings.

Colleges, hospitals, factories, airports, any place you have a large group of large buildings that is currently being heated by a central BOILER HOUSE.

Or, you could hook an electricity generator to it and have a small nuclear power plant to power a small town.
 

< Hyperion reactor    Gas boiler >


Now everyone needs to learn about being around radioactivity just as we needed to learn about being around fire.
 

How Neighborhood Nuclear Will Look 
Living around nuclear, rather than fossil, energy.    How these pint-sized reactors will be used.
The portion - yellow circled by the author - is all that would be needed for heating and cooling a
hospital complex, college or university, large factory, airport terminal, military base, office or apartment complex, etc.
This is how we will end NATURAL GAS BURNING.
By moving nuclear beyond just the big cities, large grids with their inherent electrical losses and instabilities, will be minimized. 
We will go back to the much more electrically robust times that prevailed during the thirties.
 

(Right) Thousands of small towns around the world have a few diesel generators nearby. 
These semi truck trailer diesel-powered electricity generation modules are near the town of Coldwater, Michigan.  Combined, they produce about 12 MegaWatts of electricity. 
The drawing below shows the Hyperion reactor powering a small town 25 MegaWatt nuclear power plant.
Like the diesel's radiators, the Hyperion nuclear plant has condensate cooling towers so does not need water.

As the author understands it, fresh, never used, reactor fuel rods from the factory can be safely handled with gloves.

Once in a running reactor however, fuel rods become dangerously radioactive, somewhat comparable to the danger a fossil fuel presents when it is actually burning. Unlike a fossil fuel fire, nuclear fuels do not stop fissioning quickly, needing several years to decay to a "cooled down" state that will always remain somewhat dangerous. 

Running reactors MUST have adequate radiation shielding to block the high levels of radioactivity needed to make heat.  There are many materials that make excellent nuclear barriers.  Burying a small reactor in a thick concrete vault is a good way to improve security and add additional shielding.  (Concrete and steel rebars are cheap - we make roads out of them -and moist dirt makes excellent radiation shielding.)

The Hyperion reactor is a factory sealed unit and does not have user-replaceable fuel rods.  The first Hyperion will be a 25 MWe unit with a 10 year fuel load.  When the fuel is used up, a fresh reactor is connected and the old reactor is left to allow the strong "running radioactivity" to die out (decay) for a couple of years before the reactor is ready to be loaded onto a truck for refueling at the factory.  Having a Lead-Bismuth coolant, when the reactor is cooled down, it's a solid block of metal.             (Right) Notice that the village's reactor is buried.

This is shown clearly on the Hyperion drawing (below) showing their reactor powering a small electricity generating plant.  In-ground reactor silos are provided on either side of the steam generating heat exchanger vault (bottom of drawing) to hold both an active and a cooling Hyperion Power Module (HPM).  Notice the silos are outside the electricity generator building to enable a transport truck to drive over either silo opening to deliver or remove the 20+ ton reactors by lowering or lifting them through an opening in the bed of its radiation shielded semi trailer.   http://en.wikipedia.org/wiki/Hyperion_Power_Generation 

This is a small nuclear power plant - only 25 MegaWatts electrical (MWe), ($25 million), - compared to the 1,800 MWe, ($6 billion) nuclear power plants we are used to.  It would power a town of 20,000 people and it's industries quite nicely.  If some town decided to buy a Hyperion reactor to reduce their electricity costs (nuclear electricity is cheaper than coal) they should also have access to 12 hours worth of pumped water energy storage electricity within 100 miles (Grid I2R losses become high over 100 miles.).  Nuclear likes a slowly changing load (a 50% load change can take more than an hour), pumped water energy storage can deal quickly with changing loads very nicely and also provide the reactor with some work to do during very low load times in the middle of the night.

(As an engineer who has been around utilities, the author would like to see a standby biodiesel powered 25 MWe modular combined cycle gas turbine located just beyond the cooling towers - so the combined cycle steam lines could come in alongside the tower lines.  This would add critical redundancy and extra peaking ability for little extra cost.)

For the somewhat larger 125 MWe mPower unit being offered by Babcock & Wilcox, larger market strategies come into play.  Several mPower reactors can be combined in a single power station to provide 2, 4, 8 or more multiples of 125MWe power. NSSS units could be twinned or possibly quadrupled to drive a single large turbogenerator set for larger stations, or a single reactor could connect to a single turbogenset. As a result, the mPower reactor-based power station is being marketed in three different size ranges: 500-750MWe; 125-250MWe, e.g. for municipalities or replacement of old 200-300MW coal-burning stations now considered too polluting to continue in operation; and 1000MWe or above. An attraction for larger plants is that the capacity can be added in steps rather than all at once, allowing stepwise capital investment, with the first module producing early revenue before the others are completed. The cost of competing large reactors is so high – perhaps $10 billion for two units – that it exceeds many utilities’ market capitalization, B&W's Mowry says. “You are betting the company on one station, and utilities do not want to do that.” - - Nuclear Engineering International News.

Below: Specifications for the reactor used above.  Notice formal NRC license date.  Hyperion as of Aug 10 2010 .jpg


_______________________________________________________________________

Part  8:    Big nuclear's heat weaknesses, small nuclear's heat strengths.  Big nuclear without little nuclear will kill a country's commerce and industry.

Big nuclear's heat weaknesses, small nuclear's heat strengths.
Big nuclear without little nuclear will kill a country's commerce and industry.

I2R is the kiss of death for big heating by electricity.
Ohm's Law Chart

The author defines "Big Heat" as an 800 boiler hp or larger "Industrial Strength" boiler.
(The term boiler horsepower is used for rating steam boilers and is equivalent to 34.5 pounds of water evaporated per hour at 212 degrees Fahrenheit,
or 9,809.5 watt-hours.
  Hurst boiler brochure .pdf   
To make the heat of a single 800 Boiler horsepower boiler would consume about 7.8 MWe or 1/2 of 1% of the entire output of a
modern 1,500 MWe nuclear power plant or a wind farm consisting of 24 400 foot high 1 MWe wind turbines running at wind's standard 0.33 capacity factor. 
The author considers
I2R electrical boilers in sizes between 100 Boiler HP and 800 Boiler HP to be debatable.)

This is why electricity - nuclear OR renewable - will never be used for big heat.

Electricity heat will never, ever, be nearly as efficient as simply running natural gas (or oil) through a pipe.

Think about what you have to do to make electricity from nuclear's heat or wind's mechanical energy.
With heat, you are up against the Second Law of thermodynamics.
Second Law losses are forever.
With wind, you up against both Betz's law and the Will of the Wind.
Betz's Law and the Will of the Wind will exist forever. 

Think about what happens when you run electricity downhill make heat from electricity. 

I2R heat made by electricity is the antithesis of electrical efficiency.
I2R, Second Law, and Betz's Law will always exact such heavy energy loss penalties that big industrial
and commercial heat from any electricity source will always be prohibitively expensive.

Electricity and heat are DIFFERENT grades of energy.  They will never be economically interchangeable.
Holm's Law:  Once you make big electricity, you can't afford to make big heat out of it. 
Betz's Law (wind) or the Second Law of Thermodynamics (nuclear) make electricity too valuable for heat.

http://en.wikipedia.org/wiki/Betz'_law      http://en.wikipedia.org/wiki/Second_law_of_thermodynamics     http://en.wikipedia.org/wiki/Ohm's_law 


Eventually, mankind will have to make, install, and use millions of 800+ boiler hp nuclear boilers.


This is the "Donut Hole" in everybody's energy plan.


_______________________________________________________________________

Part  9:   Economics of making fossil fuels obsolete and going nuclear. 

Economics of making fossil fuels obsolete and going nuclear.

Total costs.

The OECD report graph below shows the projected ranges of global electrical energy costs in U.S. Dollars per MegaWatt hour.  Nuclear will have a significant price advantage over both wind and fossil fuels.  Adding as much nuclear energy as possible to our energy mix will bring down all prices.  Likewise, using wind energy would cause all prices to become higher.  See:  Energy - Indirect Energy In Consumer Products .pdf  )

New power plant construction costs.

"Integrated Gasification Combined Cycle [IGCC] coal plant construction costs: The IGCC power plant in Edwardsport, expected to be in operation by 2012, will cost $2.88 billion or $4,660/kW. The 602 MW Taylorville IGCC plant will cost $3.5 billion or $5,800/kW.

The 582 MW Kemper County IGCC will cost $3.2 billion or $5,500/kW. If a traditional coal-fired plant was to be built for Kemper County, it would cost $2.4 billion or $ 4,100/kW. In this case the additional cost to opt for IGCC raises power plant cost by about 35 percent." -- -- Dr. Richard W. Goodwin, P.E., Environmental Engineering Consultant

Hyperion has stated their 25 MWe reactor module (above) will cost $1,000 per kW and that associated generic steam generation equipment and construction costs would add an additional $1,000 per kW.  At about $2,000 per kW, there is no way future coal can compete with small nuclear from suppliers such as Hyperion, NuScale (45 MWe per module "under $4,000 per kW"), or Babcock and Wilcox mPower (125 MWe per module, "less than $3,500 per kW for four 125 MWe modules").

_______________________________________________________________________


Continued on "Modern Nuclear Energy" page.